Introduction Data is said to be increasing manifoldly with each passing minute. And this has given a boost to careers in Data Science, Data Analytics and, other data operating-related fields. And with this, it becomes extremely important to visualize whatever ...
Introduction To Data Analyst vs Data Scientist We live in an age dominated by data. With the advent of smart technology, we have devices that generate data 24×7, even while we are asleep. No wonder, 90% of the world’s data ...
The latest technological advancements in Data Sciences and Machine Learning have helped transform the way we live and interact with our surroundings. We are constantly generating exponential amounts of data at a very fast pace, which the big tech companies ...
A tableau is a tool that allows you to visualise data in the most constructive format which can help make business decisions. Basically, a business intelligence tool that makes better decisions for the company but it is not only limited ...
Data Visualisation is a tool used by Data Scientist to convey important information represented by it to other people those who are not expert in the domain. Data is an extremely required part of this new age era with the ...
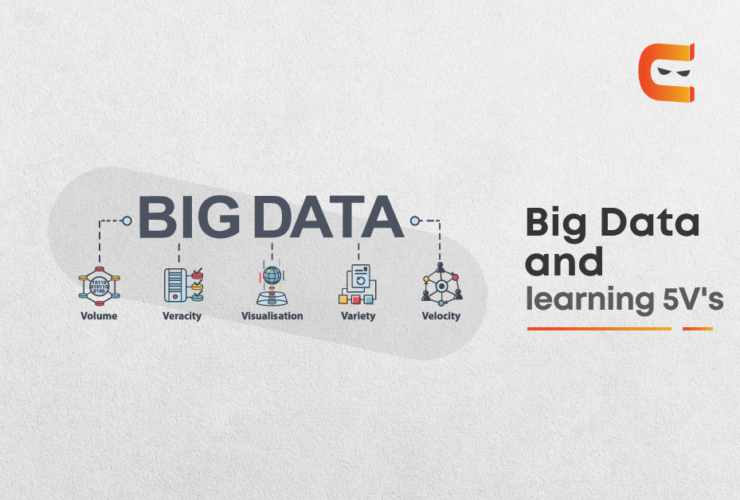
Every second, there is a huge amount of data generated that may be structured and maybe unstructured as well. Before moving to this let’s have a look at what exactly this huge data is. What is Big Data? Big Data ...
Introduction To Data Mining It is the process of extracting meaningful patterns (non-trivial, implicit, potentially useful, previously unknown) in huge data sets. As we know, we are generating data every second in millions of gigabytes around the world. Some of ...


