SDK stands for “Software development kit”. It is a complete package that contains a number of tools that facilitate software development; generally, SDKs have a text-editor, compiler, debugger, etc. in an integrated environment. You only need to download the SDK and no need of installing each tool individually. It resolves the compatibility issues that may exist between the tools if, downloaded individually. SDKs have their own hardware and software requirements like processor, RAM, Operating System, etc.
The first version of Android– Android I.0 was commercially released on 23rd September 2008. It had simple features like it could fix a few bugs and the APIs used were more advanced than the 0.9 version. Many of the APIs of this version is now deprecated. The latest commercial release by Google is Android 10.0, which was commercially released on September 3, 2019. The upcoming and the 18th version of Android SDK is Android 11.0. Its release is scheduled in 2020, it has some striking features like in-built screen recorder, Notification log for the user, automatic revoke of permissions like camera, location for the applications that have been not used in a while.
System specifications for installing Android Studio:
- Microsoft Windows Operating System ( 7/8/10 )(64-bit)
- 8 GB RAM recommended, compatible with 4 GB RAM
- 4 GB disk space recommended, minimum 2 GB is disk space is necessary (500 MB for IDE + 1.5 GB for Android SDK and emulator system image)
- 1280 x 800 minimum screen resolution
ANDROID SDK CONFIGURATION:
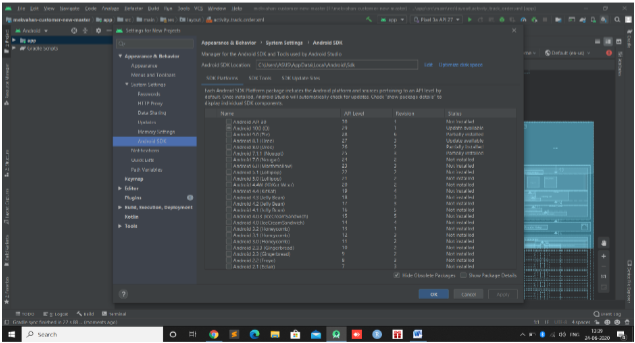
After the successful installation of the Android Studio, you need to Configure the SDK by installing the packages of the required version. Always try to go for the latest version as it has the trending APIs and the superior tools for debugging and virtual testing of the application. However, if you are working on an application that was built on an older version, you must continue to use that version, to avoid compatibility issues.
They are three methods to reach the SDK manager:
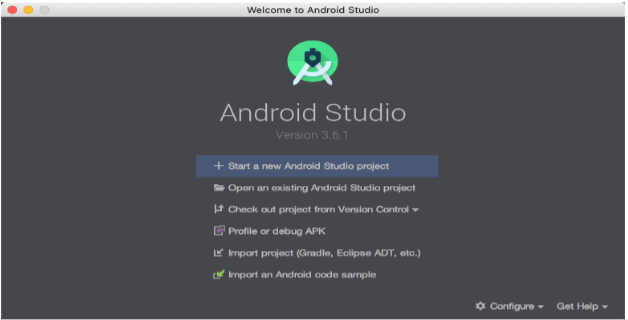
Method 1 (Initial set-up): As soon as, the installation of Android Studio is completed, you are directed to the Welcome Screen of the Android studio. On the lower-right corner, Select SDK Manager from the menu Configure drop-down, and select the desired version.
Method 2: While you are already working on the android studio, and you need to download any version of the Android SDK. Go the Tools menu and select the SDK Manager.
Method 3: We can find the SDK Manager icon, in the toolbar. The second icon from the right side represents the SDK Manager. A list of all the Android Versions, even Android 1.0, which was introduced 12 years ago, is present. We can install more than one SDK version on our PC at a time.
ANDROID SDK TOOLS:
Tools are the components of the Android SDK. The tools perform the various functions of debugging, virtual testing, configuration, and adaptation. It is a utility of the tools that made any SDK dependable. With the advancement of technology, the obsolete tools were eliminated from the newer versions and superior tools were added.
Let’s go through the features of Android SDK tools:
EMULATOR:
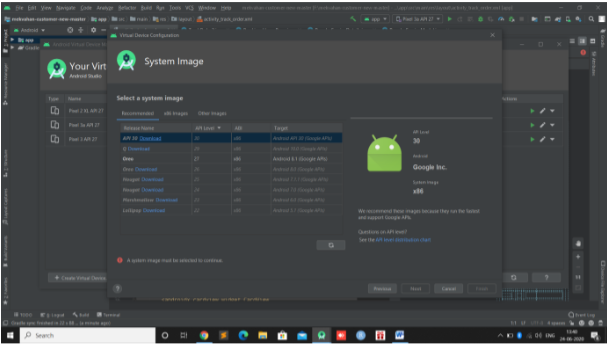
The Android emulator creates a virtual Android device so that we can test the functionalities of our application even without having a tangible android system. The Android emulator is available in various Android versions like Jellybean, Lollipop, Oreo, etc., covering a wide range of screen resolutions and API versions. It is available in variable screen sizes so that we can customise our user-interface design accordingly. The Android Emulator performs almost all the functions of a real Android device, we can even capture screenshots on the emulator, type messages, simulate virtual phone calls, use Google play, perform screen rotations, cheque network connectivity, and test all the functions and receive the same response as a real android device. The emulator is very useful when a physical android device is not available. During presentations and creating video tutorial emulator has proved its necessity.
The Android emulator has its own additional system requirements:
- SDK Tools minimum version should be 26.1.1
- It is compatible only with a 64-bit processor. Android Emulator was deprecated in June 2019 for 32- bit Windows systems.
- Windows: Central Processing Unit having Unrestricted Guest support
- HAXM 6.2.1 is the minimum requirement (HAXM 7.2.0 or later recommended)
- For installing the Android Emulator, click on the Android Emulator component in the SDK Tools tab present in the SDK Manager.
ANDROID DEBUG BRIDGE (ADB):
Android Debug Bridge allows us to initiate communication with a device. It is a command-line tool. We can debug as wells as test the working of an android application by using ADB commands. It helps us to control the UNIX shell of the device with the help of command-lines. It is basically a client-server programme. We can have control of the entire Operating System of the device by writing a few commands.
Android Debug Bridge is made by three major components:
- The client: The Client has the superiority as it is the client that commands the device by using ABD commands. The client here runs on the Android development machine.
- The daemon (adbd): It is a background tool. It is responsible for running the commands given by the client on the target. It functions as a background thread on the device.
- The server: It also runs as a background thread on our development machine-an emulator or a real android device. The main role of the server is to establish and maintain uninterrupted communication between the client and the daemon (abdb).
- For installing the Android Debug Bridge, click on the Android Debug Bridge in the Platform SDK Tools tab present in the SDK Manager.
MINIFY & PROGUARD:
When minifyEnabled is set to true, the process of Code Shrinking, technically known as “tree
shaking” is carried out. In the process the piece of code which is not used is in the application anywhere is enabled automatically. The R8 creates a tree by connecting all the Libraries of the various APIs, their class members, the functions, and the member variables. The useless functions and variables are rendered unconnected as they form unreachable nodes since they are unused. These unused nodes are eliminated from the tree, thereby shrinking the size of the tree and also justifying the name of the process as “Tree Shaking”.
This helps a lot in code optimisation. When we link any dependency with our application, all the methods that come under that library gets loaded in our application, even if we use only two or three methods, the rest remains in our application, and contribute to an unnecessary increase in the size and the run-time of the application. Hence, the elimination of these functions becomes a necessity, which is carried out by minify. There must be a cheque laid on R8 to carry out tree shaking, these rules are laid down by Proguard. We can even add customised proguard rules if we want to keep some methods for future use. Some of these are automatically generated by the compiler and cannot be modified.
ANDROID PROFILER/DDMS:
The DDMS is available up to Android Version 3.0, and is deprecated and replaced by Android Profiler now. The Android Profiler provides us with advanced and high tech services like:
- Message Formation: It is mainly used by customer care services, home delivery applications, or money transfer applications, to dispatch an auto-generated SMS to the customer in various instances. It becomes very difficult to form these messages manually; hence Android Profiler provides services that can carry out such functions very smoothly and effortlessly.
- Call Spoofing: Many users prefer to hide their information by Caller IDs. This platform provides us to hide our information and even customise our information by ourselves to avoid ambiguity and abstract unwanted information.
- Capturing Screenshots: Some Android devices allow us to take Intruder Selfie. This is facilitated by these tools. This also helps us to identify the area of the app that uses high power, modify the animated used in our application, prevent freezing or crashing of the application.
To enable the Dalvik to debug monitor service click on Tools>Android>Android device Monitor.
To enable Android Profiler: Click on Run > Edit Configurations>Select your app module in the left pane>Click on the Profiling tab and then select Enable advanced profiling.
VISUAL LAYOUT EDITOR:
The Android Studio allows us to design the User Interface of the application in various layouts. It
allows enables us to preview it in the User mode and also gives u the preview of the blueprint of the UI. There are various layouts like the Constraint Layout, Linear Layout, Relative Layout, Frame Layout, etc. We can even design the UI in Grid View, ListView, Adaptor View, Web View, etc. We can make sure that all the components are proportional by considering the “preview” that Android Studio provides us.
To read more about Android, view here.
By Vanshika Singolia


